By La Formule FrançaisePublished 7 min read
Losses and gains are not symmetrical, and the asymmetry gets worse the larger the loss. This is arithmetic rather than opinion, and it does not depend on which strategy produced the loss.
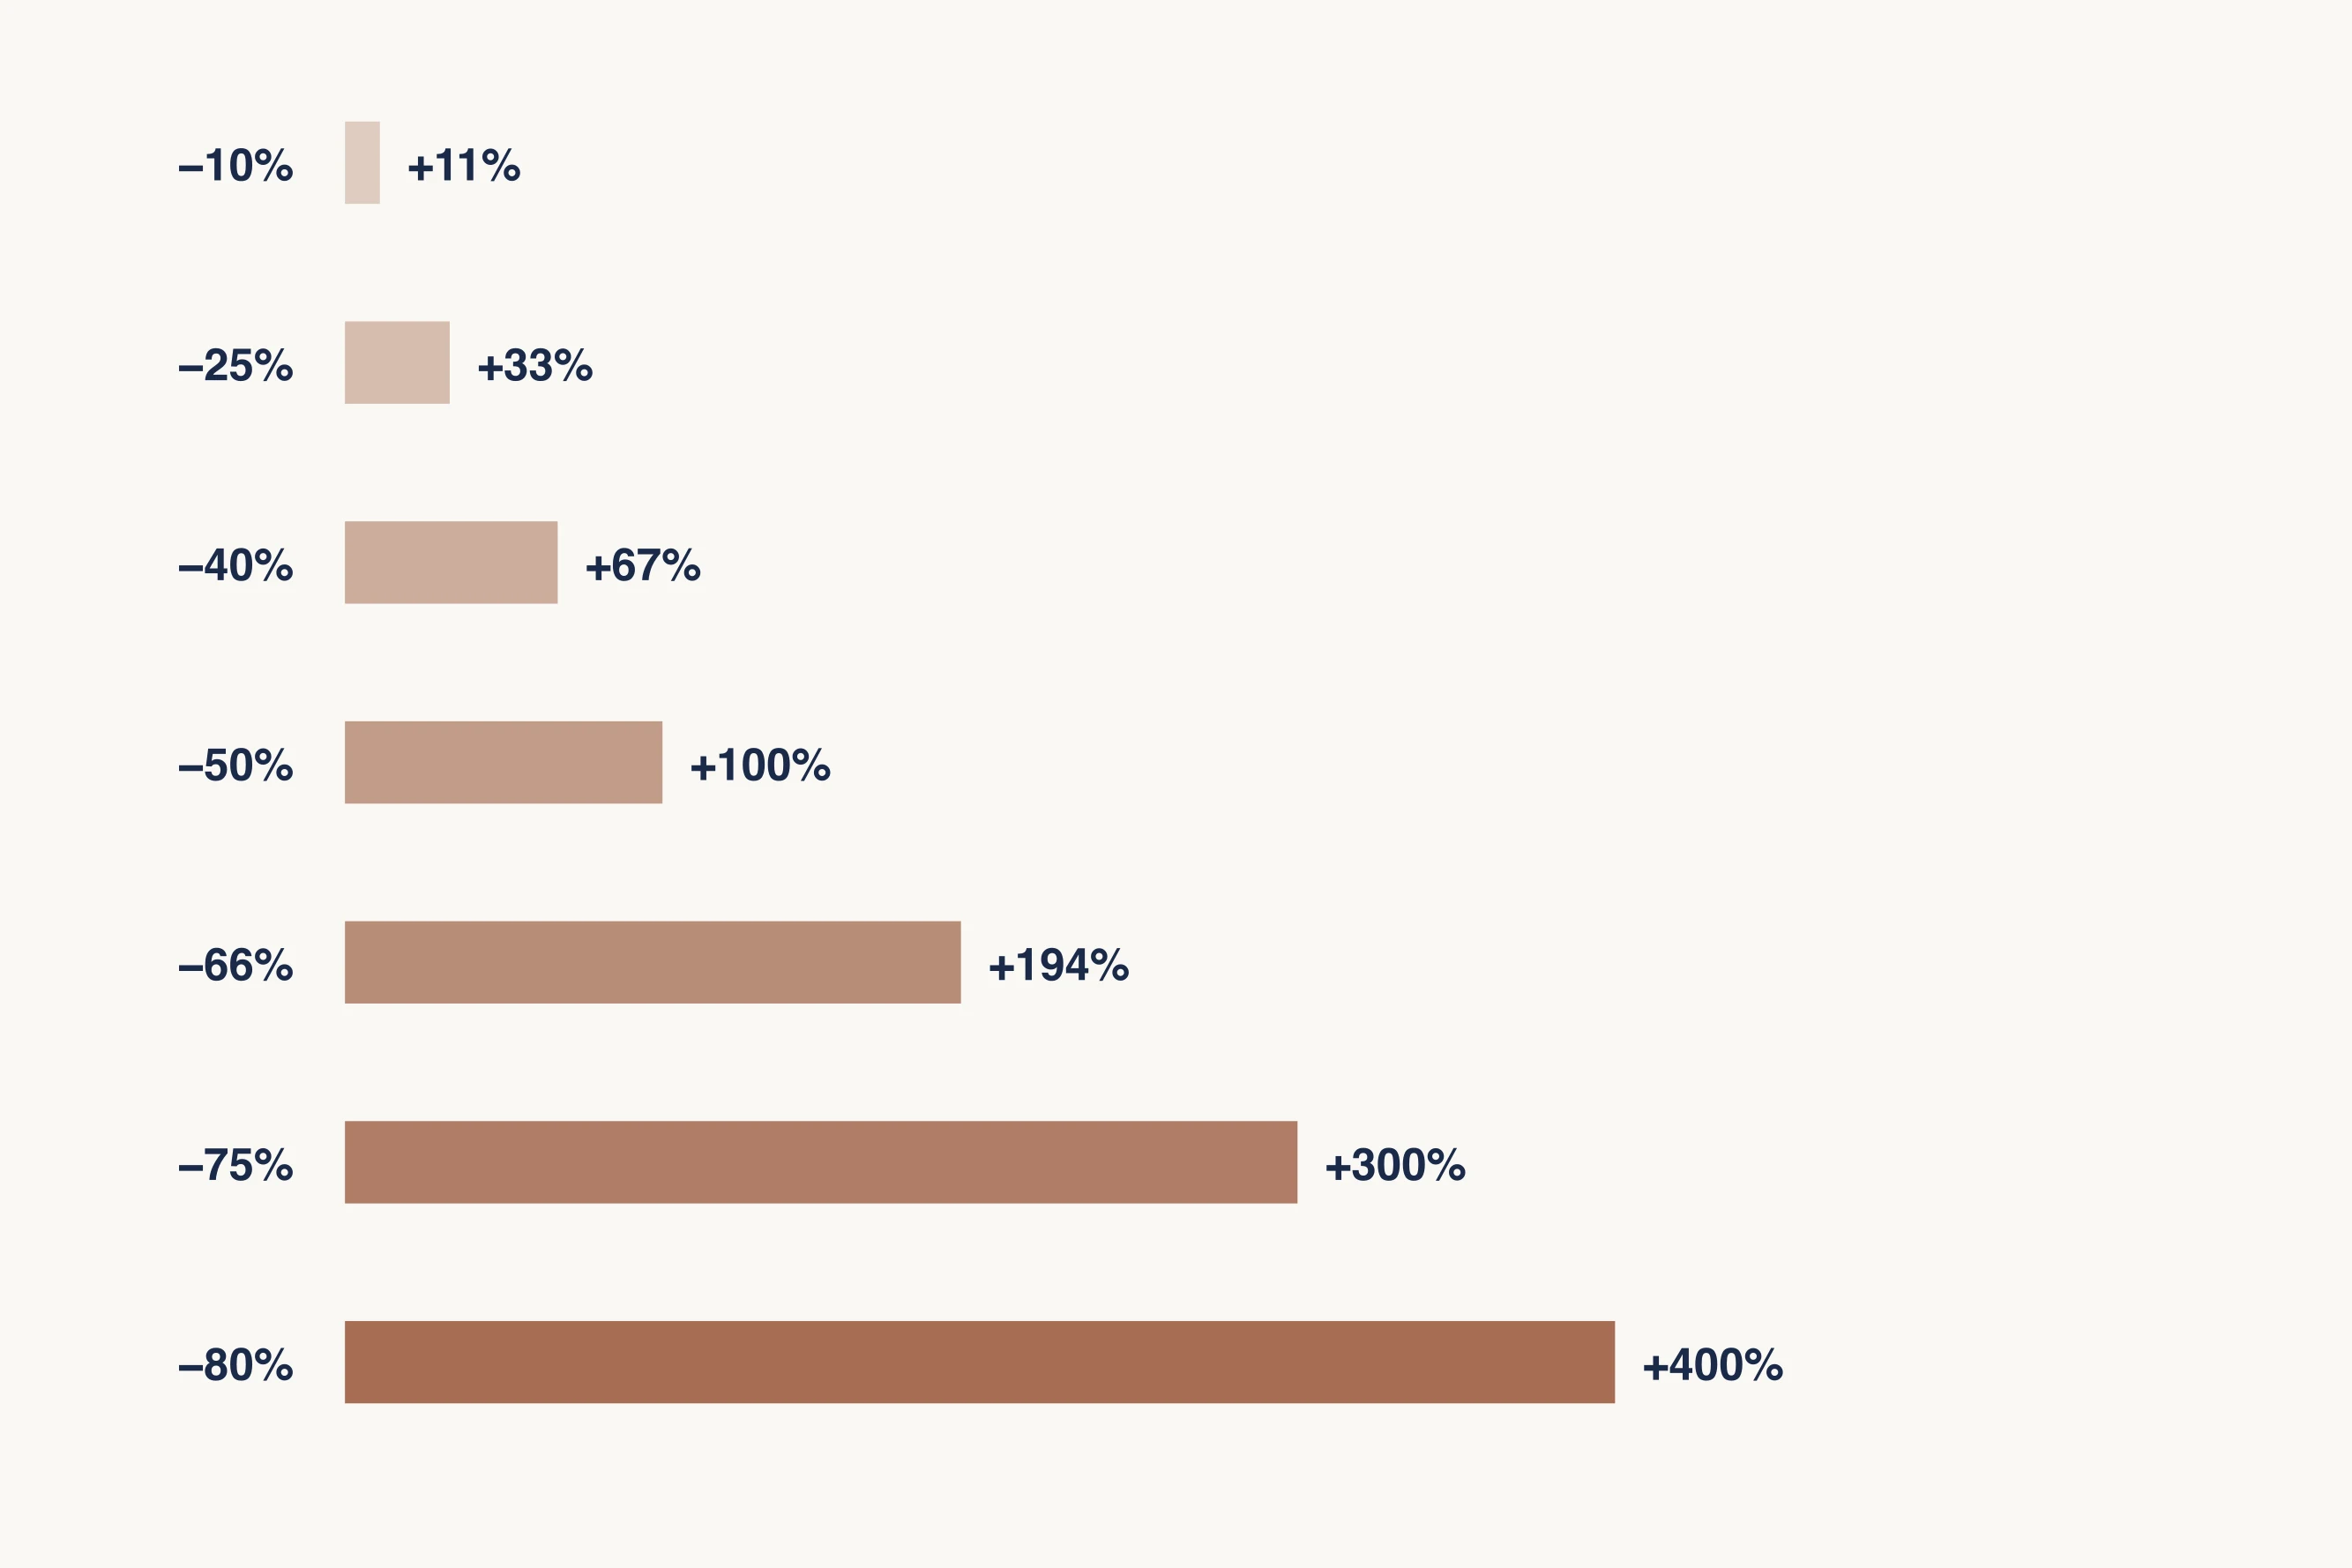
Recovering from a loss always takes a larger gain than the loss itself, and the gap widens fast.
The recovery asymmetry
Lose 10% and you need about 11% to get back. Lose 25% and you need 33%. Lose 50% and you need 100%. Lose 80% and you need 400%.
The reason is that the gain is calculated on the reduced balance. Each further loss makes the required recovery grow faster than the loss did, which is why the curve steepens rather than sloping evenly.
This is why maximum drawdown is a more informative number than total return, and why it is the number most often absent from a promotional chart.
What drawdown actually measures
Maximum drawdown is the largest peak-to-trough fall over the period. Two things about it are routinely underexplained.
First, it is a historical worst case, not a limit. A system whose worst historical fall was 30% has not promised to stop at 30%.
Second, its duration matters as much as its depth. A 20% fall that recovers in a month and a 20% fall that lasts two years are very different experiences, and only the second one tests whether anybody actually sticks with the plan.
How leverage changes the arithmetic
Leverage multiplies the result of a price move in both directions, but the two directions are not equivalent, because there is a floor and no ceiling.
At five times leverage a 20% move against the position removes the entire margin. At ten times, 10% does it. Liquidation is not a bad outcome within the strategy; it is the end of the strategy, after which no subsequent recovery in the price helps at all.
This is the mechanism by which a system that would have been merely unprofitable becomes terminal.
Risk of ruin
Given a per-trade loss size and a win rate, there is a calculable probability of losing everything before any long-run edge has a chance to express itself. The larger the fraction risked per trade, the higher that probability, and it rises much faster than the fraction does.
The practical consequence: a strategy can be genuinely profitable on average and still bankrupt the account, if the amount committed per trade is large enough that a normal losing streak reaches zero first.
Questions worth asking about any track record
None of these are difficult to answer if the record is real, and all of them are routinely absent when it is not.
- What was the maximum drawdown, and over what period was it measured?
- How long did the worst drawdown last from peak to full recovery?
- What leverage was used, and was it constant?
- What fraction of the account was committed to a single position?
- Was there a liquidation, and if so, is it in the record?