By La Formule FrançaisePublished 9 min read
Five stages sit between a price arriving and a position existing. Each one has a characteristic way of going wrong, and most of them are invisible in a performance chart.
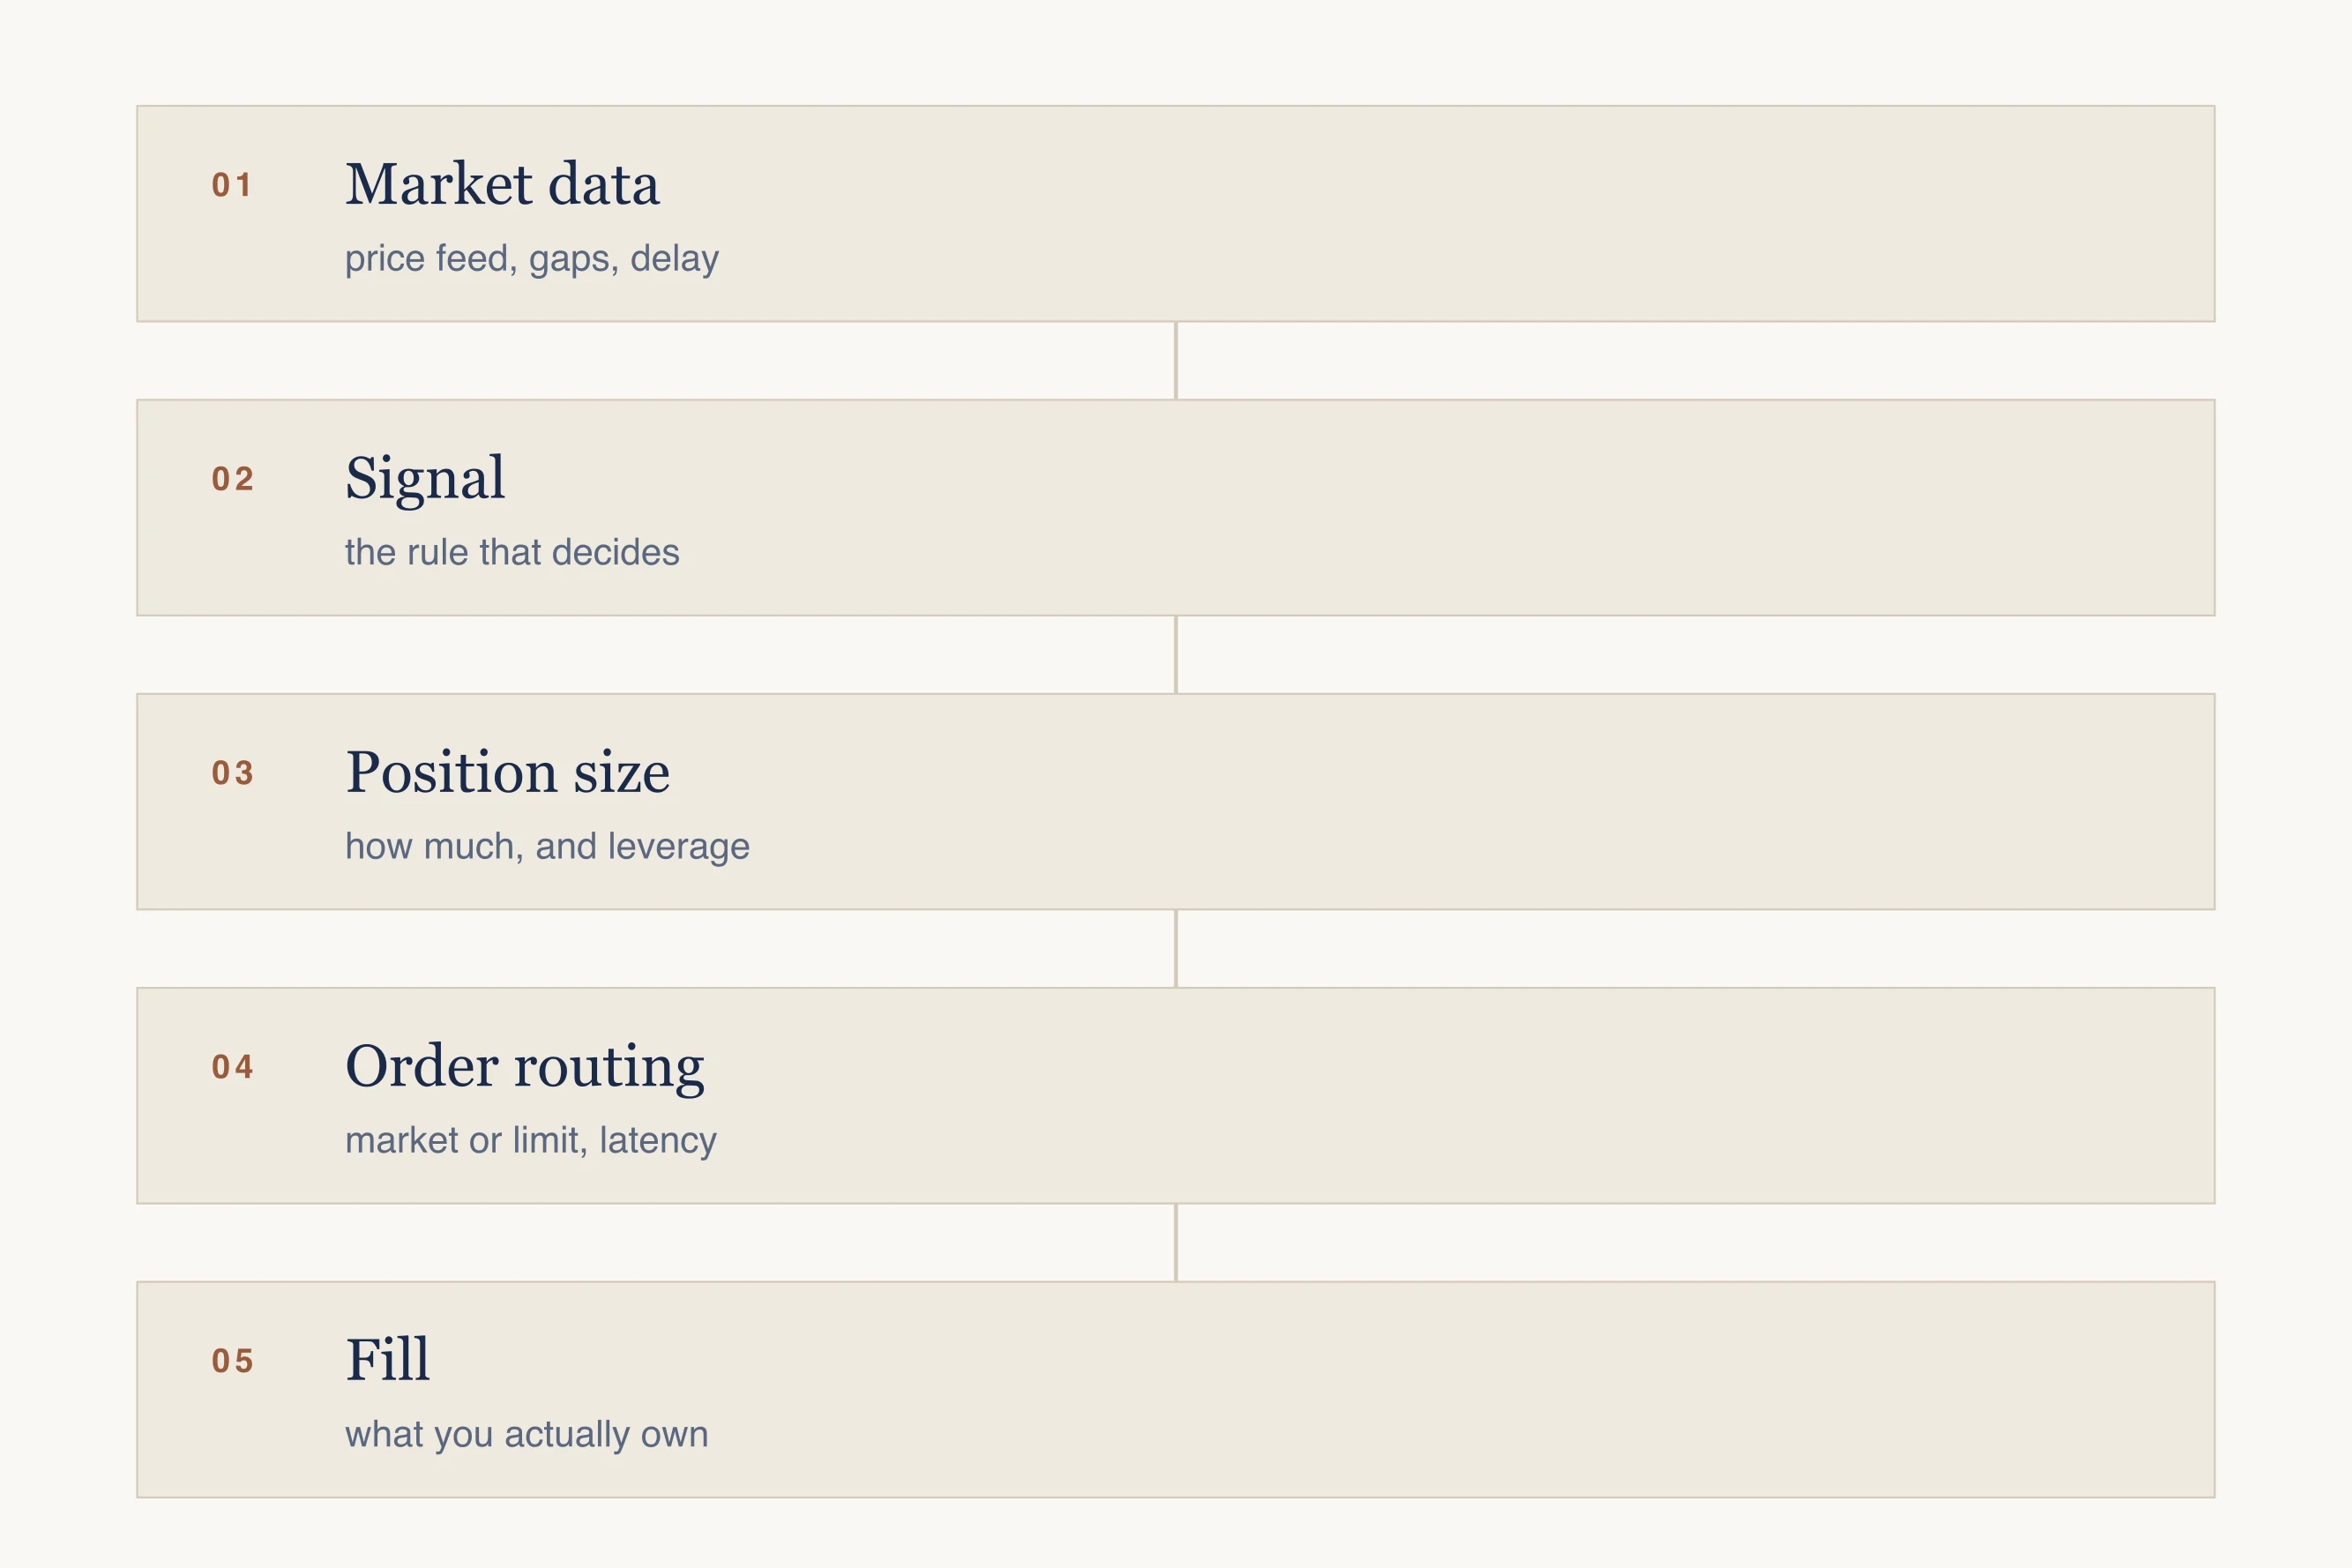
A system is only as good as its worst stage, and the worst stage is usually the one nobody demonstrates.
1 · Market data
The system needs to know the current price, and "the current price" is less obvious than it sounds. A venue publishes a stream of trades and a stream of order-book updates; both arrive with delay, both can gap, and both can be briefly wrong during volatility.
The common failure is a system tested on clean, evenly spaced historical bars and then run on a live feed that stutters. The rule was never asked what it should do when a price is late, duplicated or missing.
2 · Signal
This is the part that gets shown. A rule turns the data into a decision: enter, exit, do nothing. It can be a moving-average crossover or a fitted model, and the complexity of it is a poor guide to whether it works.
The failure here is subtler than a bad rule. It is a rule that was chosen because it happened to fit the period it was measured on. That is covered in full on the backtesting page, because it is the single most common reason a demonstrated system stops working when real money is behind it.
3 · Position sizing
Once the rule says buy, something has to decide how much. This stage is routinely omitted from demonstrations and routinely decides the outcome.
Two systems with the identical signal and opposite sizing rules produce completely different accounts: one survives a losing streak and one does not. Sizing is also where leverage enters, and leverage is the fastest way to convert a survivable drawdown into a terminal one.
4 · Order routing
The decision becomes an instruction sent to a venue over an API. Order type matters here in a way backtests rarely capture.
A market order is filled immediately at whatever price is available, which during fast movement is not the price the signal saw. A limit order gets the price you asked for or no fill at all — and the trades it misses are disproportionately the ones that would have been profitable, because the market moved away for a reason.
Backtests usually assume you were filled at the price on the chart. Live, you were not.
5 · Fill and reconciliation
The order comes back partly filled, fully filled, rejected or, worst of all, silent. The system now has to know what it actually owns, which is not always what it thinks it ordered.
This is unglamorous engineering and it is where real systems spend most of their defect budget: duplicate orders after a reconnect, a position held open because a cancel was never confirmed, a stop that was never actually placed at the venue.
What a demonstration usually omits
When a system is presented as evidence, it is worth asking which stages you have been shown.
- Was the data the same feed the live system would use, or clean historical bars?
- Was the sizing rule stated, and did it include leverage?
- Were fills assumed at the chart price, or modelled with a spread and a delay?
- Were fees, funding and withdrawal costs deducted?
- Over how many separate market regimes was it run, and were the losing ones shown?