By La Formule FrançaisePublished 8 min read
If you try enough rules against the same history, one of them will look excellent. That is a property of searching, not a property of the rule. Understanding this is most of what separates a plausible system from a demonstrated one.
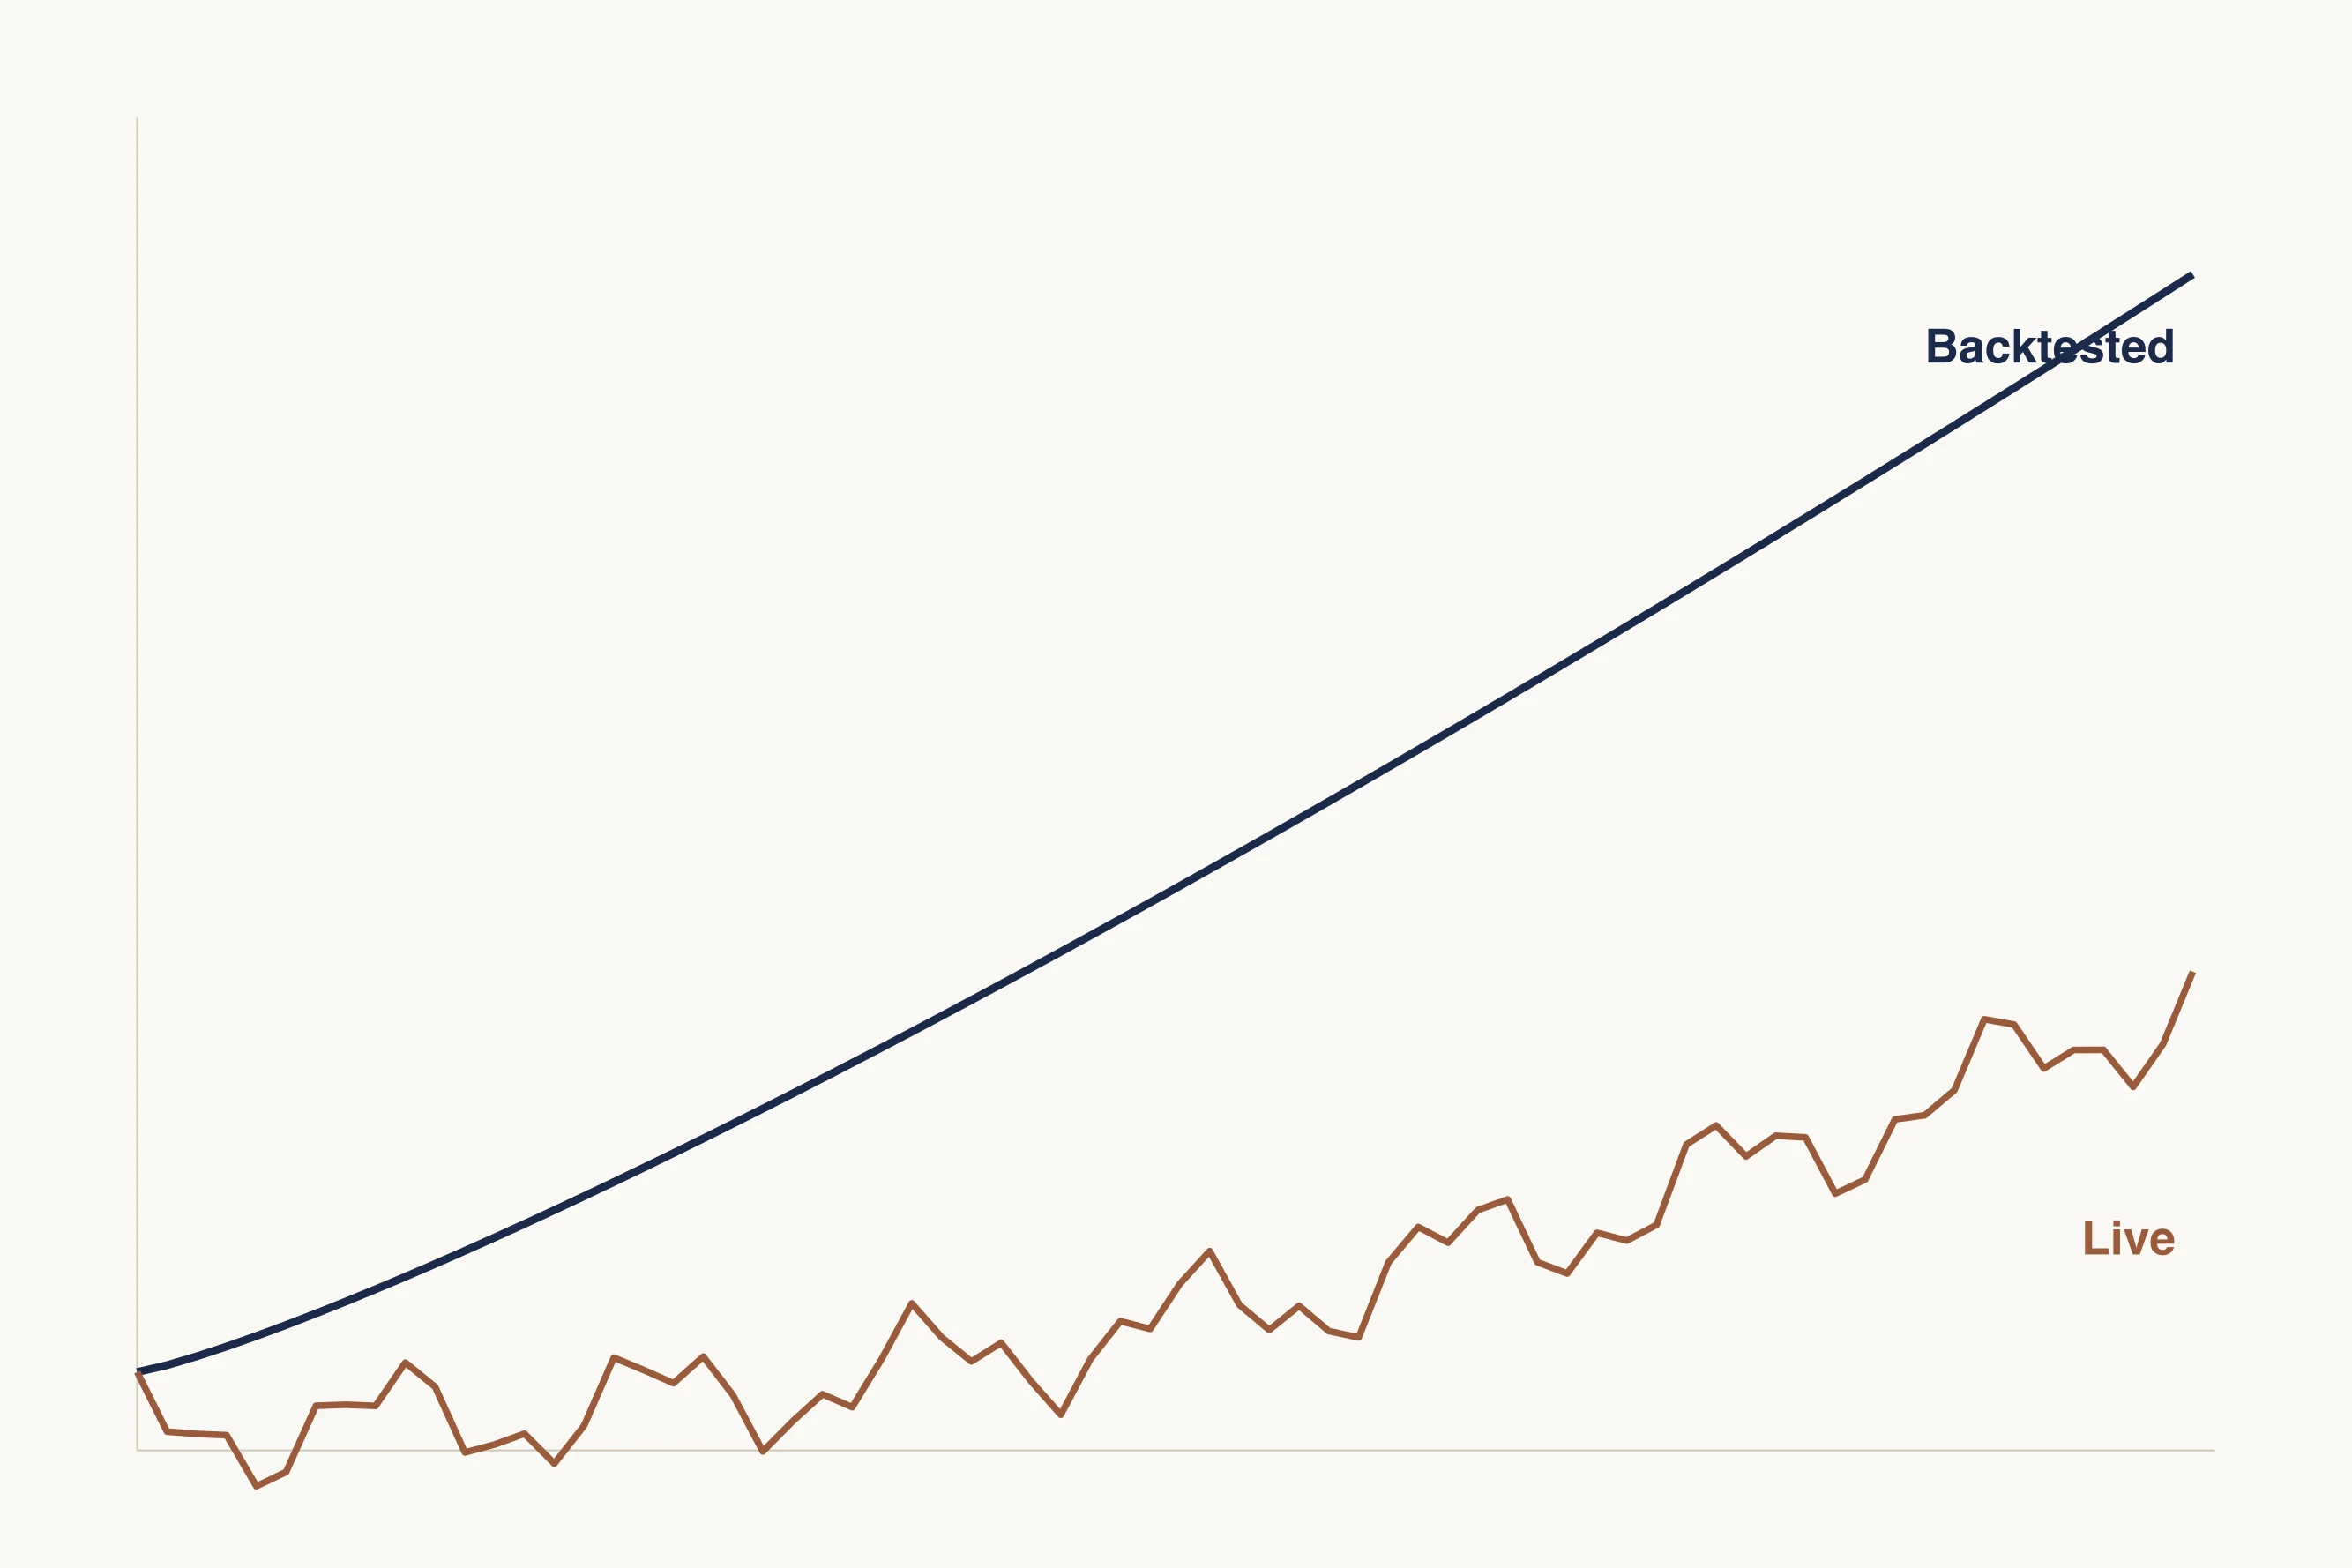
A backtest tells you what would have happened to a rule you already know worked. It is evidence about the past, and weak evidence about anything else.
Overfitting, stated plainly
Take any period of price history and any rule with adjustable settings. Vary the settings enough and some combination will have produced an excellent result over that period. It will have done so partly because the rule captured something real, and partly because it happened to match the noise in that particular stretch.
The trouble is that the two contributions look identical on the chart, and only one of them will still be there next year. The more settings you were free to vary, and the shorter the period you tested, the larger the second contribution is likely to be.
The biases that inflate a curve
These are not exotic. They are the ordinary ways a historical test ends up measuring something other than what it claims.
- Look-ahead bias: the test used information that was not available at the moment the decision was made — a closing price to decide an entry during that same bar, or a figure that was revised after the fact.
- Survivorship bias: the instruments tested are the ones that still exist. Assets that failed and were delisted are missing, so the sample is drawn from the winners.
- Selection bias: the result you are shown is the best of many attempts, and the others were not published.
- Regime bias: the test covers a single market condition. A trend-following rule tested only through a sustained rise has not been tested.
- Cost omission: fees, spread, slippage and funding are left out, which flatters short-horizon systems most of all.
Why out-of-sample testing helps and does not settle it
The standard remedy is to fit on one period and test on another that was held back. This is a genuine improvement and it is worth insisting on.
It is also weaker than it appears, because a researcher who checks the held-back period, adjusts the rule and checks again has quietly turned it into part of the fitting set. After enough iterations the out-of-sample period is no longer out of sample in any meaningful way.
Questions that separate a test from a demonstration
None of these are difficult to answer if the work was done.
- How many variants were tried before this one was presented?
- What period was held back, and was it looked at more than once?
- Were costs deducted, and at what assumed spread and slippage?
- How many market regimes does the period cover, including at least one sustained fall?
- What was the worst peak-to-trough loss, and how long did it take to recover?
- Is there live performance, and does it match the test?
Paper trading is not the answer either
Running a system on simulated money in live conditions removes look-ahead bias, which is real progress. It does not remove the two things that most often break a system: your orders were never actually in the book competing with anyone, and no one's behaviour changes when the losses are not real.
A paper record is better evidence than a backtest and much weaker evidence than a traded account.